
Marco Denisi


In Klarna, I work in a team called Post Purchase Decisioning (aka PPD). We take care of a product called Skan, which is used by internal stakeholders (called fraud agents) to work on all the orders in Klarna that can be fraudolent.
This is a story all about how my life got flipped-turned upside down we approached the so called Peak Season (the range of time between the Black Friday and Christmax) and in detail, how we discovered and fixed a bottleneck. Enjoy!

The Peak Season is just around the corner, and as everyone in Klarna we need to be sure we won’t blow up like a balloon.
The SKAN backend can be roughly split in two different parts:
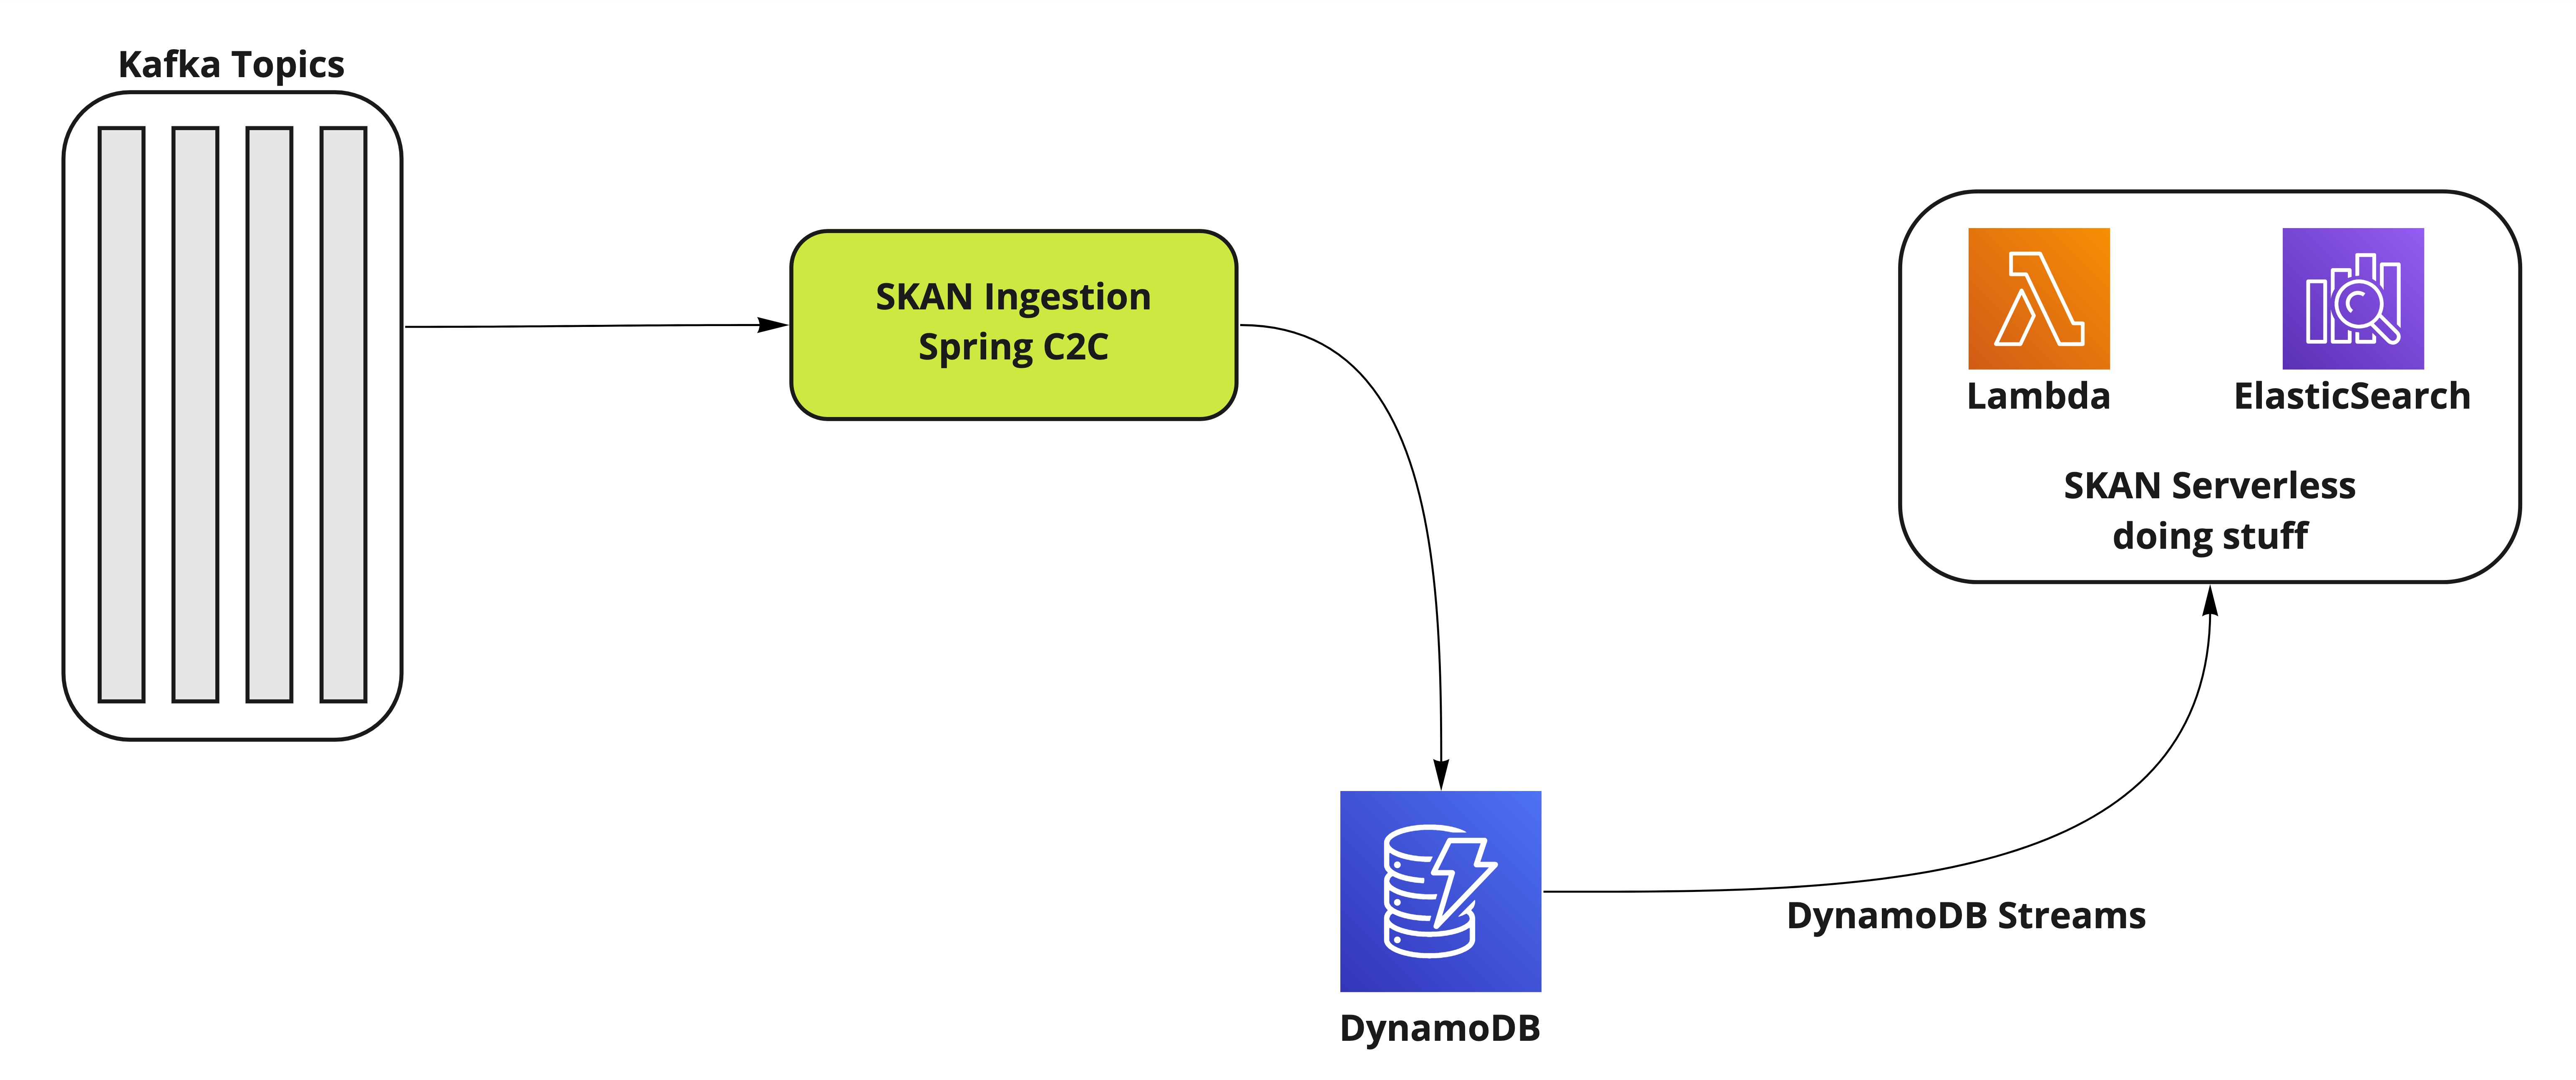
What we wanted to do, is to start checking if our ingestion was good enough to keep up with the expected load: 9K kafka messages per second during peak seconds. This is our environment setup:
We started producing 9K events per second using cheetah, an internal framework based on locust, and that’s the result:
To sum up:
We wanted to minimize the consumer lag though. So, under the hypothesis that more instances would mean ingesting more messages, we decided to warm up the pool and then to hit it with everything we’ve got.
Another thing we did was increase the number of partitions of the kafka topic we were using to mimic the production environment and better balance the consumers/partitions ratio.
Spoiler alert: that didn’t work.

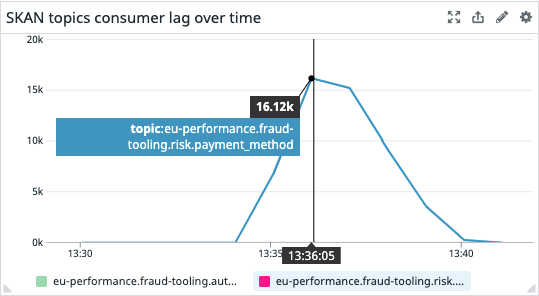
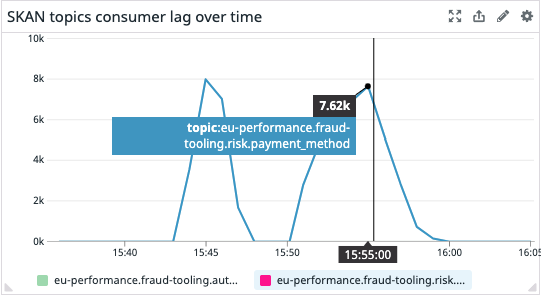
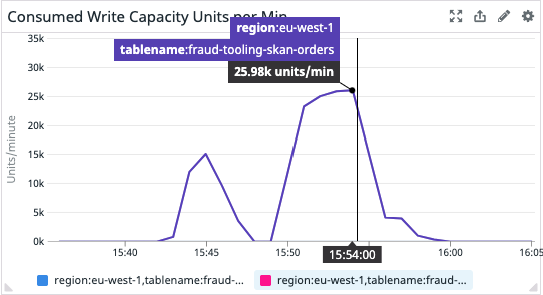
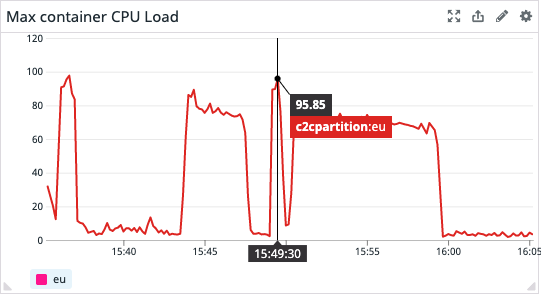
Without further ado, here’s the results of the warming up experiment plus the actual load test:
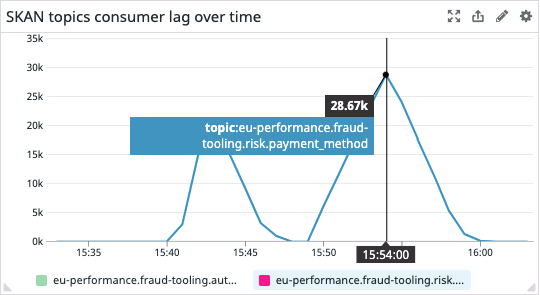
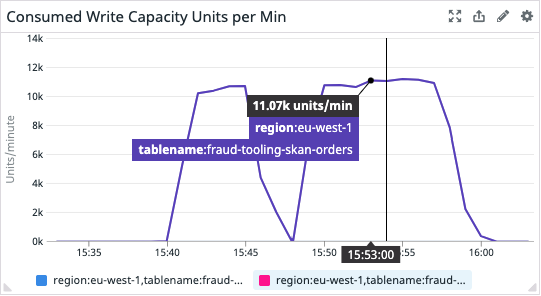
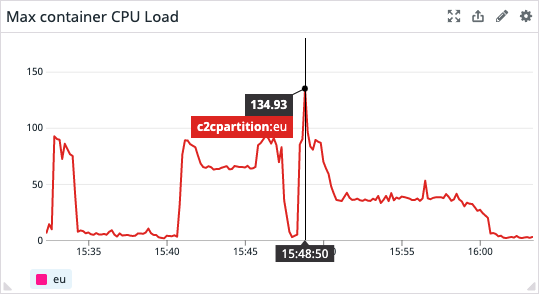
You can clearly see the warm up run and then the actual load test run by looking at the metrics above.
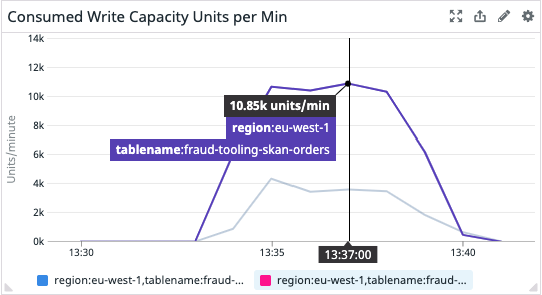
Again, let’s put together some considerations:
The most suspicious thing is DynamoDB write units being “locked” to 11K per minute. DynamoDB can write way more than this, so it can’t be a real bottleneck. But clearly, something’s going on there.
The focus then moved to how we persist data in DynamoDB. One interesting metric to check is the SuccessfulRequestLatency, which, according to the AWS documentation:
The successful requests to DynamoDB or Amazon DynamoDB Streams during the specified time period
….
SuccessfulRequestLatency reflects activity only within DynamoDB or Amazon DynamoDB Streams, and does not take into account network latency or client-side activity.
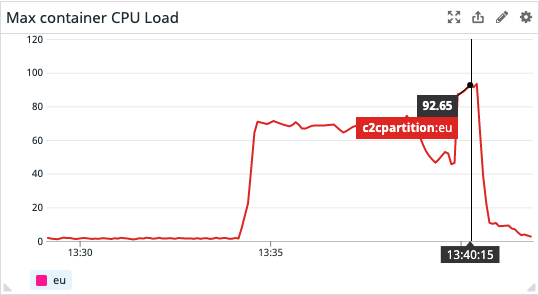
And while the average value was ok-ish, that’s what we got when we looked for the maximum value:
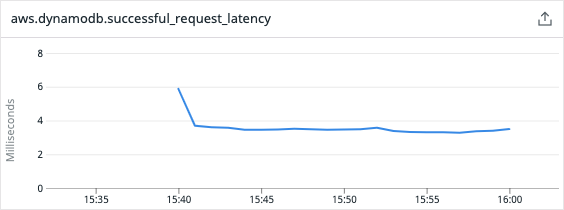
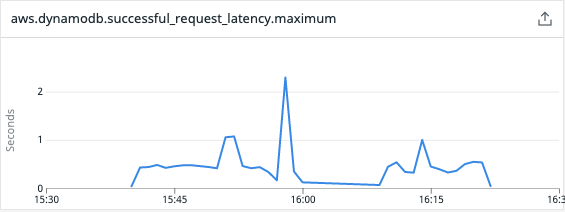
We got one peak of over 2 seconds and multiple peaks over 1 second! There was of course some issue with that. We used the DynamoDB client offered by the AWS SDK v1, which we discovered being synchronous and blocking! This means that each and every thread performing http calls to AWS will wait for the response. And this means a lot of wasted time doing basically nothing.
Thus we decided to try the shiny new DynamoDB Enhanced Client. As stated in the official documentation, the main difference is
The AWS SDK for Java 2.x features truly non blocking asynchronous clients that implement high concurrency across a few threads. The AWS SDK for Java 1.x has asynchronous clients that are wrappers around a thread pool and blocking synchronous clients that don’t provide the full benefit of nonblocking I/O.
This would mean that even if the DDB latency can have peaks, we no longer wait for each call to finish, instead we offload this “I/O” operation to another thread. Let’s see this new client in action.
Results are really promising. To sum up:
The only drawback is that we almost broke DynamoDB. In fact, we reached an upper limit for which DynamoDB had to scale. We were not resilient to that scenario (aka we didn’t retry on that error), so this is something we definitely need to address and something we wouldn’t have noticed if we hadn’t done performance tests.